
Home Dashboard
Home Dashboard Basics
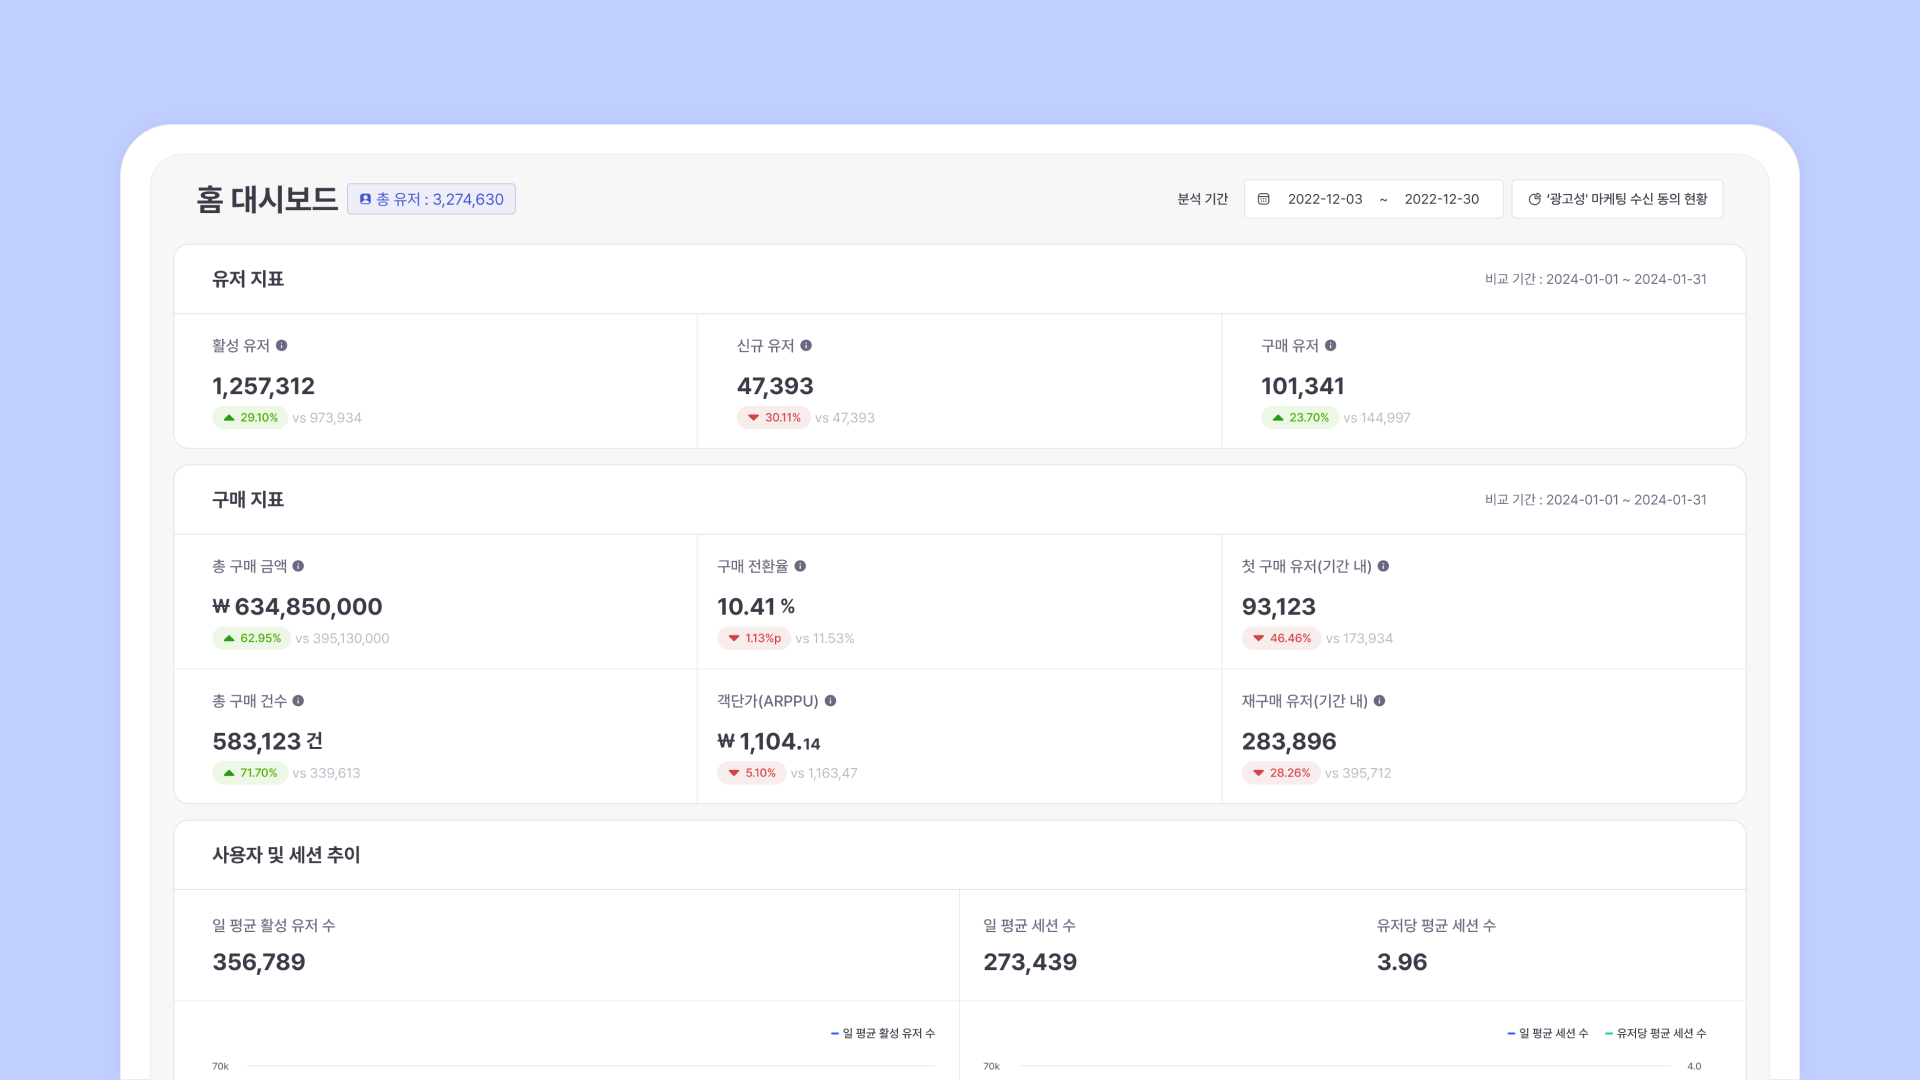
The Home Dashboard is the first screen that is designed to provide users with a quick overview of key metrics they frequently need to check. You can quickly understand key figures such as user metrics, purchase metrics, user and session trends, and if additional analysis is needed, you can create and check a separate report.
Total number of users and consent status to receive 'advertising' marketing
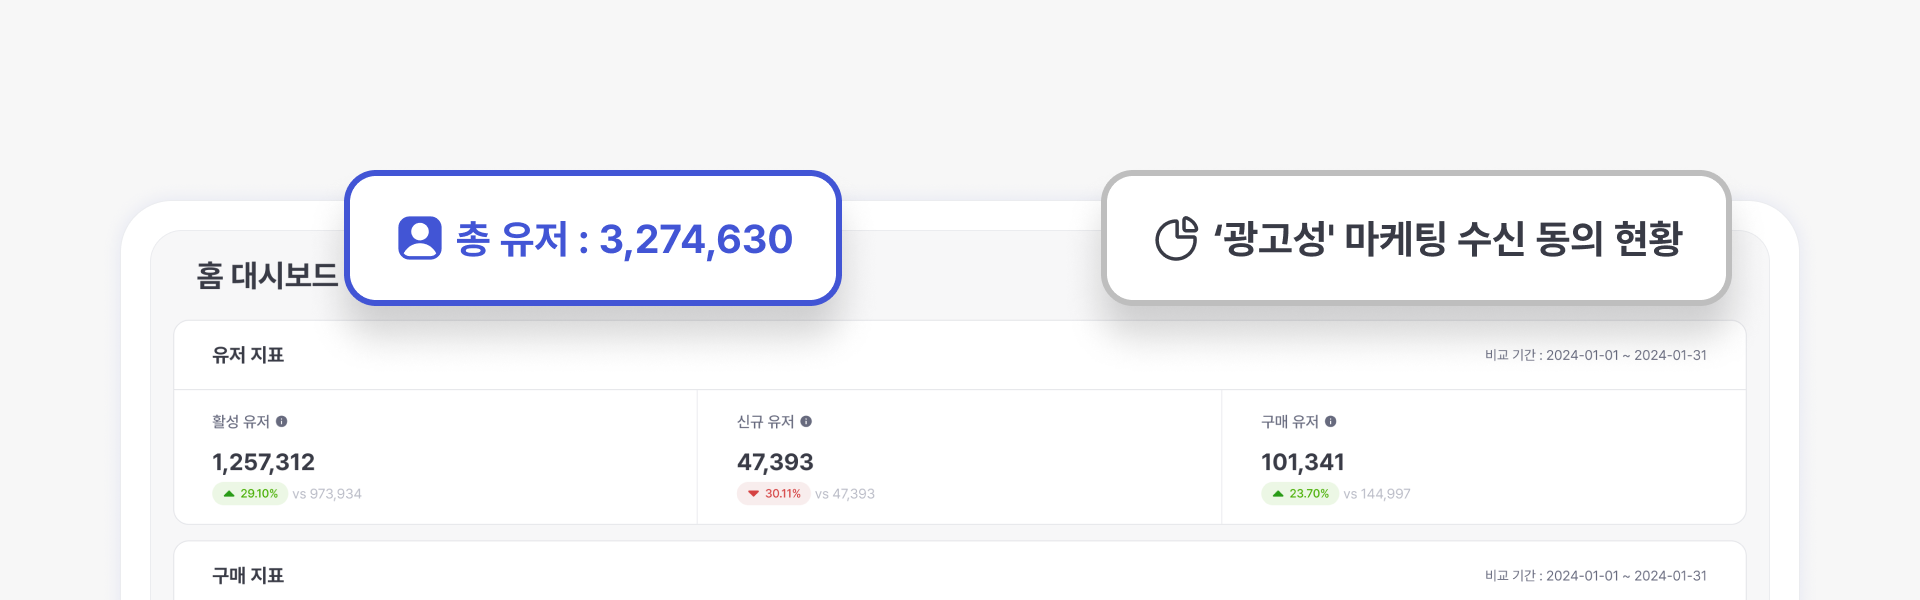
The total number of users and 'advertisement' marketing consent status provided on the home dashboard are figures based on user profile information, regardless of the analysis period.
Additional explanation
For example, in the case of events such as logins or purchases, one user can trigger multiple events, and you can check how many events occurred and at what point in time-based on the set search period. However, in the case of data based on user profile information such as age and gender, only the most recently updated values are reflected. Please note that the total number of users and consent status for receiving advertising marketing is also data based on user profile information.
Each measurement method is as follows.
Total number of users
Total number of users
Total unique count of users collected based on unified ID
Consent to receive 'advertising' marketing
The ratio of consent to receive ‘advertising’ marketing refers to the ratio of users who consent to receive marketing for each channel compared to the total number of users.
It is expressed by rounding to two decimal places according to the definition policy. For example, if there is a very small number of people who have consented to receive marketing, and it is 0.001%, etc., it will be exposed as 0.00%. However, in this case, it is displayed as '0.00%' rather than '-'.
How to calculate key indicators
The main metrics on the dashboard are calculated based on the selected analysis period. The default is the last 30 days (excluding the current day), and you can check the metrics based on the data collected during this period.
User metrics
This is an indicator of the number of active events, new events, and purchase events that each user generated in the service during the analysis period.
Active users
The number of unique active events that occurred during the analysis period. (Unique Count)
New user
The number of unique active events that occurred when a user first accessed the service during the analysis period (Unique Count)
Purchasing user
Number of purchase events that occurred during the analysis period (Unique Count)
Purchase indicator
A metric calculated from purchase events that occurred in the service during the analysis period and the attributes of those events.
Total purchase amount
The total sum (Sum) of the attribute df_total_purchase_amount that occurred during the analysis period
Total number of purchases
The total number of purchase events that occurred during the analysis period. (Total Count)
Purchase Conversion Rate (%)
The ratio of purchasing users to active users during the analysis period
First time purchaser (within the period)
If the total number of purchase events that occurred during the analysis period (Total Count) is 1
※ This is only valid within the analysis period and does not mean the number of first-time purchasing users during the entire period.
Repurchasing users (within the period)
If the total number of purchase events (Total Count) that occurred during the analysis period is 2 or more
※ Valid only within the analysis period and does not indicate the number of repeat purchasers during the entire period.
Average Price Per Unit (ARPPU)
The average sales generated from one purchase, are calculated by dividing the total purchase amount during the analysis period by the number of purchase events during the same period.
User and Session Trends
You can check the daily changes in user and session trends. Hover over the graph to see the increase/decrease rate compared to the previous day.
Number of users
Average daily active users
A value calculated by dividing the total number of active users (Sum) during the analysis period by the number of days within the analysis period.
Number of sessions
Average number of sessions per day
A value calculated by dividing the total number of sessions (Sum) during the analysis period by the number of days within the analysis period.
Average number of sessions per user
A value calculated by dividing the total number of sessions (Sum) during the analysis period by the total number of users (Sum) during the analysis period.
Overall Event Rankings (Top 10)
Number of users (Unique Users)
Unique number of events that occurred per user
Total Count
Aggregate number of total events
Funnel Analysis
You can check the number of events that occurred according to the specified event flow. This funnel is counted only when each step is carried out sequentially. For example, if a purchase event occurs immediately after viewing the home screen, the purchase event is not counted.
To check the indicator, you must register all five events below in the event registration screen.
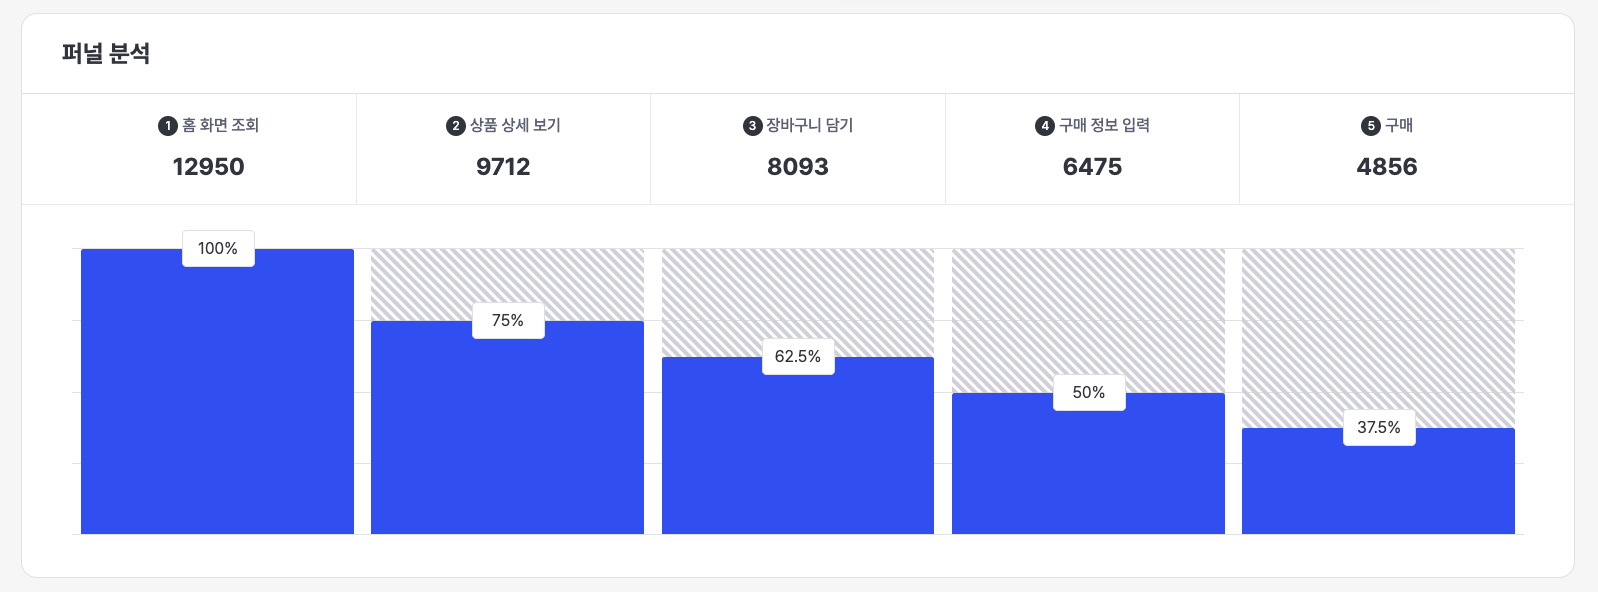
1 STEP
View Home Screen
Unique Count of unique events for home screen views (df_view_home) that occurred during the analysis period
2 STEP
View product details
The number of unique events (Unique Count) for product detail views (df_view_product_details) that occurred after performing step 1 during the analysis period.
3 STEP
Put in a shopping cart
Unique Count of events for adding to cart (df_add_to_cart) that occurred after performing steps 1 and 2 during the analysis period.
4 STEP
Enter purchase information
Unique Count of unique events for purchase information entry (df_add_payment_info) that occurred after performing steps 1, 2, and 3 during the analysis period.
5 STEP
Purchase
Unique Count of purchases (df_purchase) that occurred after performing steps 1, 2, 3, and 4 during the analysis period.
Purchase status
When a purchase event occurs, you can check the top 5 rankings based on the product name and category included in the product information, sales, number of sales, and sales quantity.
At this time, the product category is not a required linkage item, so the indicator confirmation may vary depending on whether the category is linked.
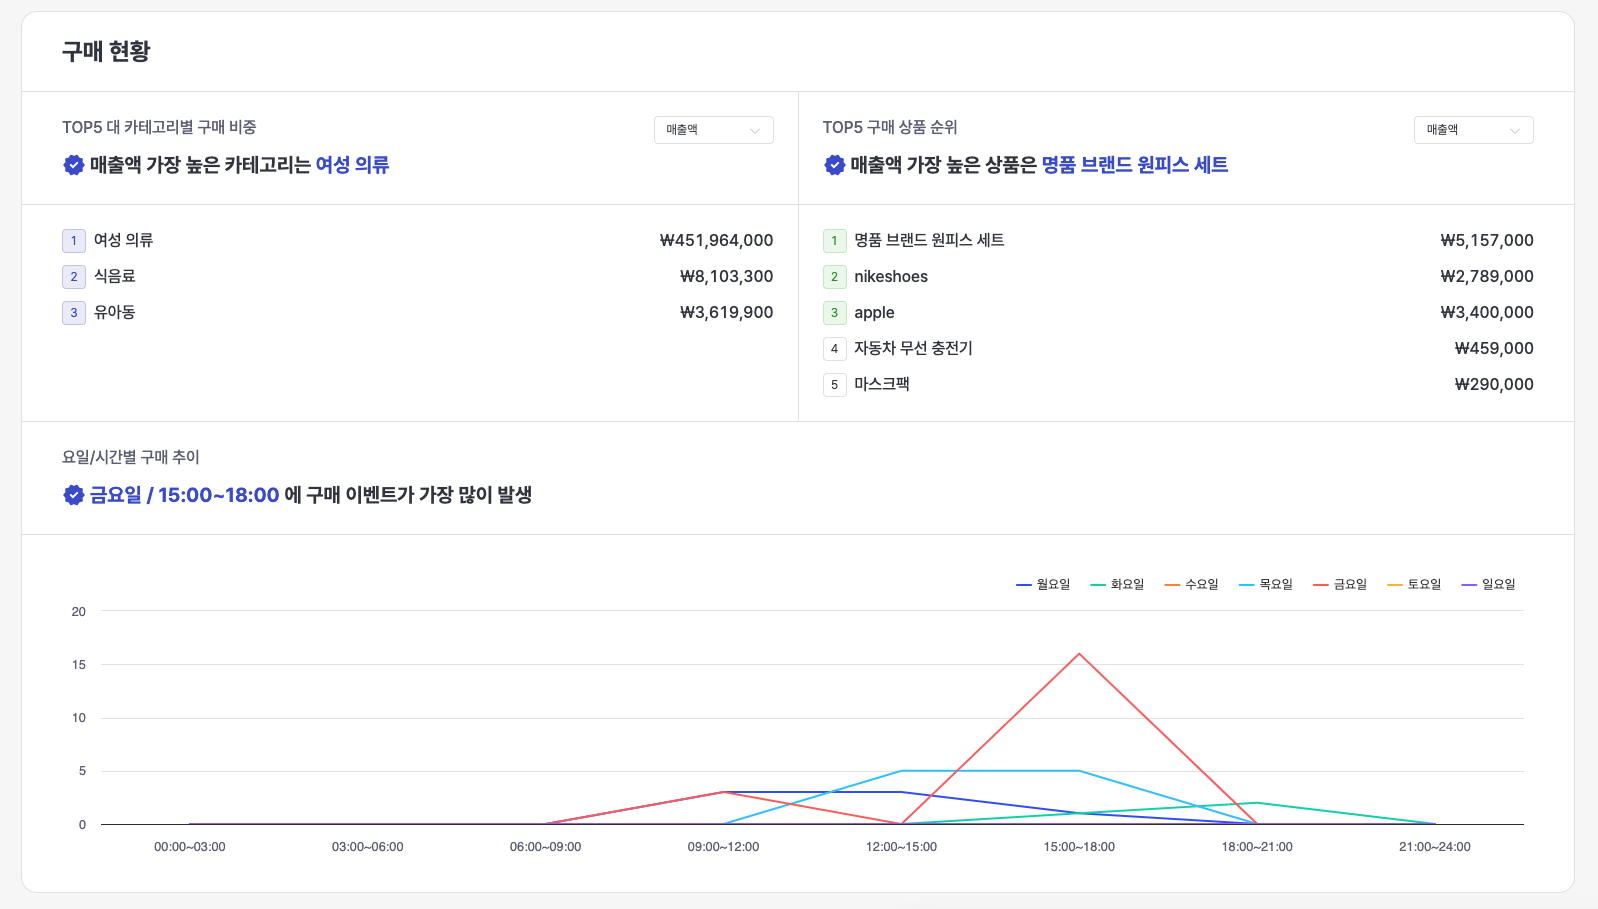
Purchase Status by Major Category (Top 5)
Take
The total sum (Sum) of the order total (df_total_purchase_amount) among the sub-attributes of the purchase event (df_purchase) by category during the analysis period
Number of sales
Total number of purchase events (df_purchase) by category during the analysis period (Total Count)
Sales quantity
The total sum (Sum) of the product quantity (df_items > df_quantity) among the sub-attributes of the purchase event (df_purchase) by category during the analysis period
Purchase Status by Purchased Product (Top 5)
Take
Sum of the total order amount (df_total_purchase_amount) for each product purchased during the analysis period
Number of sales
Total number of purchase events (df_purchase) for each product purchased during the analysis period (Total Count)
Sales quantity
The total sum (Sum) of the product quantity (df_items > df_quantity) among the sub-attributes of the purchase event (df_purchase) for each purchased product during the analysis period
Offsite Campaign Performance
The figures displayed on the summary card represent the indicators for the entire channel, and you can also check the indicators for each channel (push, notification talk, text) in the list.
Transmission successful
Number of messages successfully sent within a set period
Click
• Push: Open message (based on internal counting)
• KakaoTalk/Text: Click message (based on internal counting)
Click-through rate
The ratio of the number of clicks on a message to the number of successful deliveries
Purchase Conversion
The number of purchase events that occurred within the * lookback window period after the click event occurred
Purchase Amount
Total purchase amount of the purchase conversion event
Average Conversion Value
Average sales per purchase conversion, calculated by dividing the total purchase amount by the number of purchase conversions
Shipping Cost
A value calculated by multiplying the unit price per channel by the number of successful transmissions
ROAS
A value calculated by dividing the purchase amount by channel by the shipping cost by channel
Purchase Conversion Lookback Window
If a purchase event occurs after a user clicks on messages sent from multiple channels, the last channel clicked is recognized as the purchase conversion channel.
DFINERY's default conversion lookback window is set to 24 hours, so only purchase events that occur within 24 hours of a click on a message sent from a specific channel are counted as conversions.
Additionally, if the campaign has ended, click counts will be collected for up to 7 additional days, and counts will not be collected for subsequent periods.
Onsite Campaign Performance
The numbers displayed on the summary card represent metrics for the entire channel, and you can also check metrics for each channel in the list.
Exposure
Total number of campaigns exposed based on the integrated ID within the set period (Total Count)
Click
Image and button clicks excluding the close (X button, bottom button) and in-app message background clicks
Click-through rate
The ratio of clicks on a message to the number of impressions
Purchase Conversion
The number of purchase events that occurred within the *lookback window period after the click event occurred
Purchase Conversion Rate
The ratio of actual purchases to the number of clicks, calculated as a percentage by dividing the number of purchase conversions by the number of clicks and multiplying by 100
Purchase Amount
Total purchase amount of the purchase conversion event
Average Conversion Value
Average sales per purchase conversion, calculated by dividing the total purchase amount by the number of purchase conversions
Purchase Conversion Lookback Window
The same policy applies as for the off-site purchase conversion lookback window, and in the case of cross-campaign campaigns, the campaign corresponding to the last click is recognized as the purchase conversion campaign.
Last updated