
Create an Insight Report
Insight reports are a type of report that allows you to visualize the trend of event occurrence over a period of time. Follow the steps below to learn how to check the report metrics.
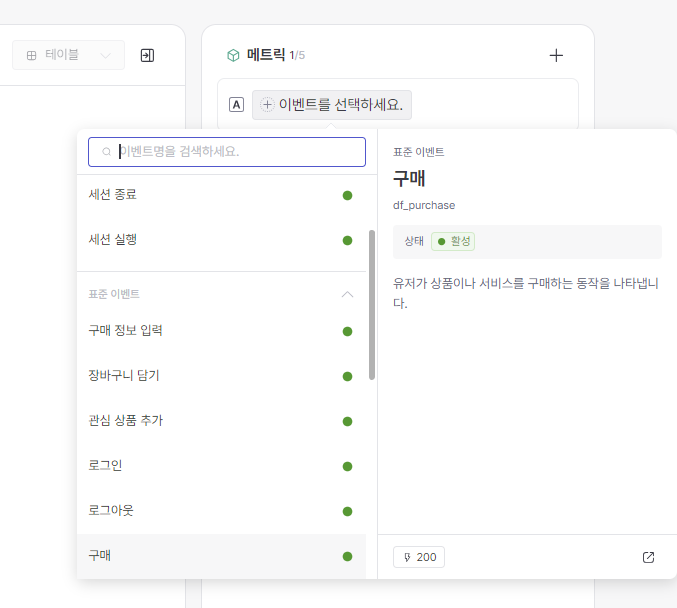
Action selection
Metrics are the basic building blocks of Insights reports, consisting of events and a way to measure the number of those events. Select an event and Select an event click the " " button to start with event-based metrics.
Metrics can be set for up to 5 events.
Select a measurement value
After you select a specific event, you can choose how to measure that event. When you select an event, Definer uses Count as the default measurement method. Count refers to the total number of times the selected event occurred during the analysis period.
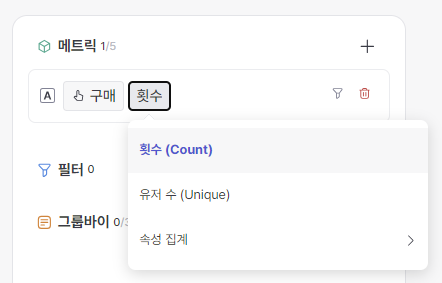
Number of occurrences : The total number of occurrences of the event
Number of users : The number of unique users that triggered the event (usually less than the count)
Attribute Aggregation : The following aggregation methods are provided based on the data type of each attribute, calculated using the event sub-attributes.
String
Unique (Fixed)
Integer (Long)
Real Number (Double)
Sum / Average / Min / Max
List of strings
Not supported
List of Long/Double
Not supported
True/False (Boolean)
Not supported
Date and Time
Not supported
String Enum
Not supported
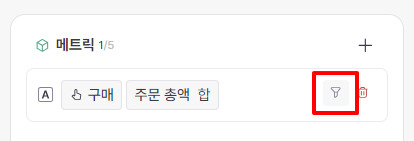
Setting up metric filters
You can exclude a step if you do not want to apply a filter.
You can apply metric-specific filters by hovering your mouse over each metric.
Filters support sub-event properties of the selected metric or properties automatically collected from the definer.
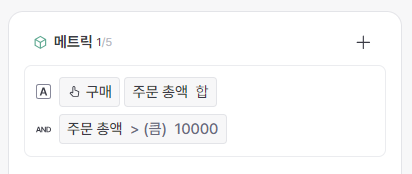
For example, if you want to see purchase indicators for cases where the total order amount is greater than 10,000 won, set it as follows:
Set all filters
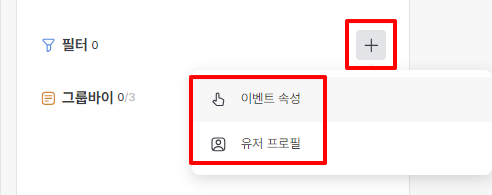
Similarly, for the overall filter, you can exclude that step if you don't want to apply the filter. Click the + button to set the event properties or user profile data as filtering conditions.
Notes on setting filters
You cannot set duplicate filters with the same attribute.
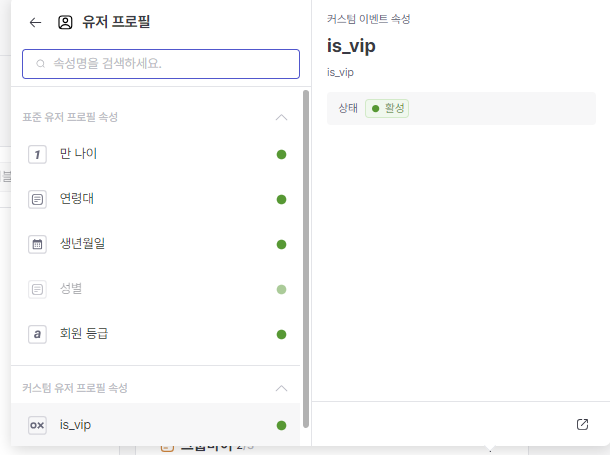
A full filter allows you to select the entire event property, unlike a subfilter on a metric.
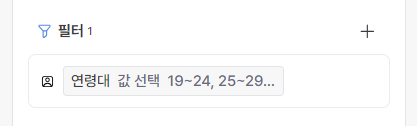
In the User Profile Properties, you can select User Properties, Recent Device Properties, and Behavioral Properties.
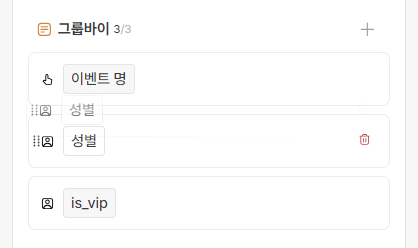
Group by settings
If you want to divide your data into groups, set Group By. Set the data items linked to the event/event attribute and user profile to Group By.
For example, if you want to see purchase events by "City", add the "City (IP)" attribute to GroupBuy.
Things to note when setting up group buy
Group Buy can be set up to 3 times .
Data is grouped according to the set group by order and displayed in the report results table.
If you want to change the order of the Group By items, hover your mouse over the Group By item and a drag-and-drop icon will appear. Drag and drop them according to the desired sort order and then click the [Apply] button.
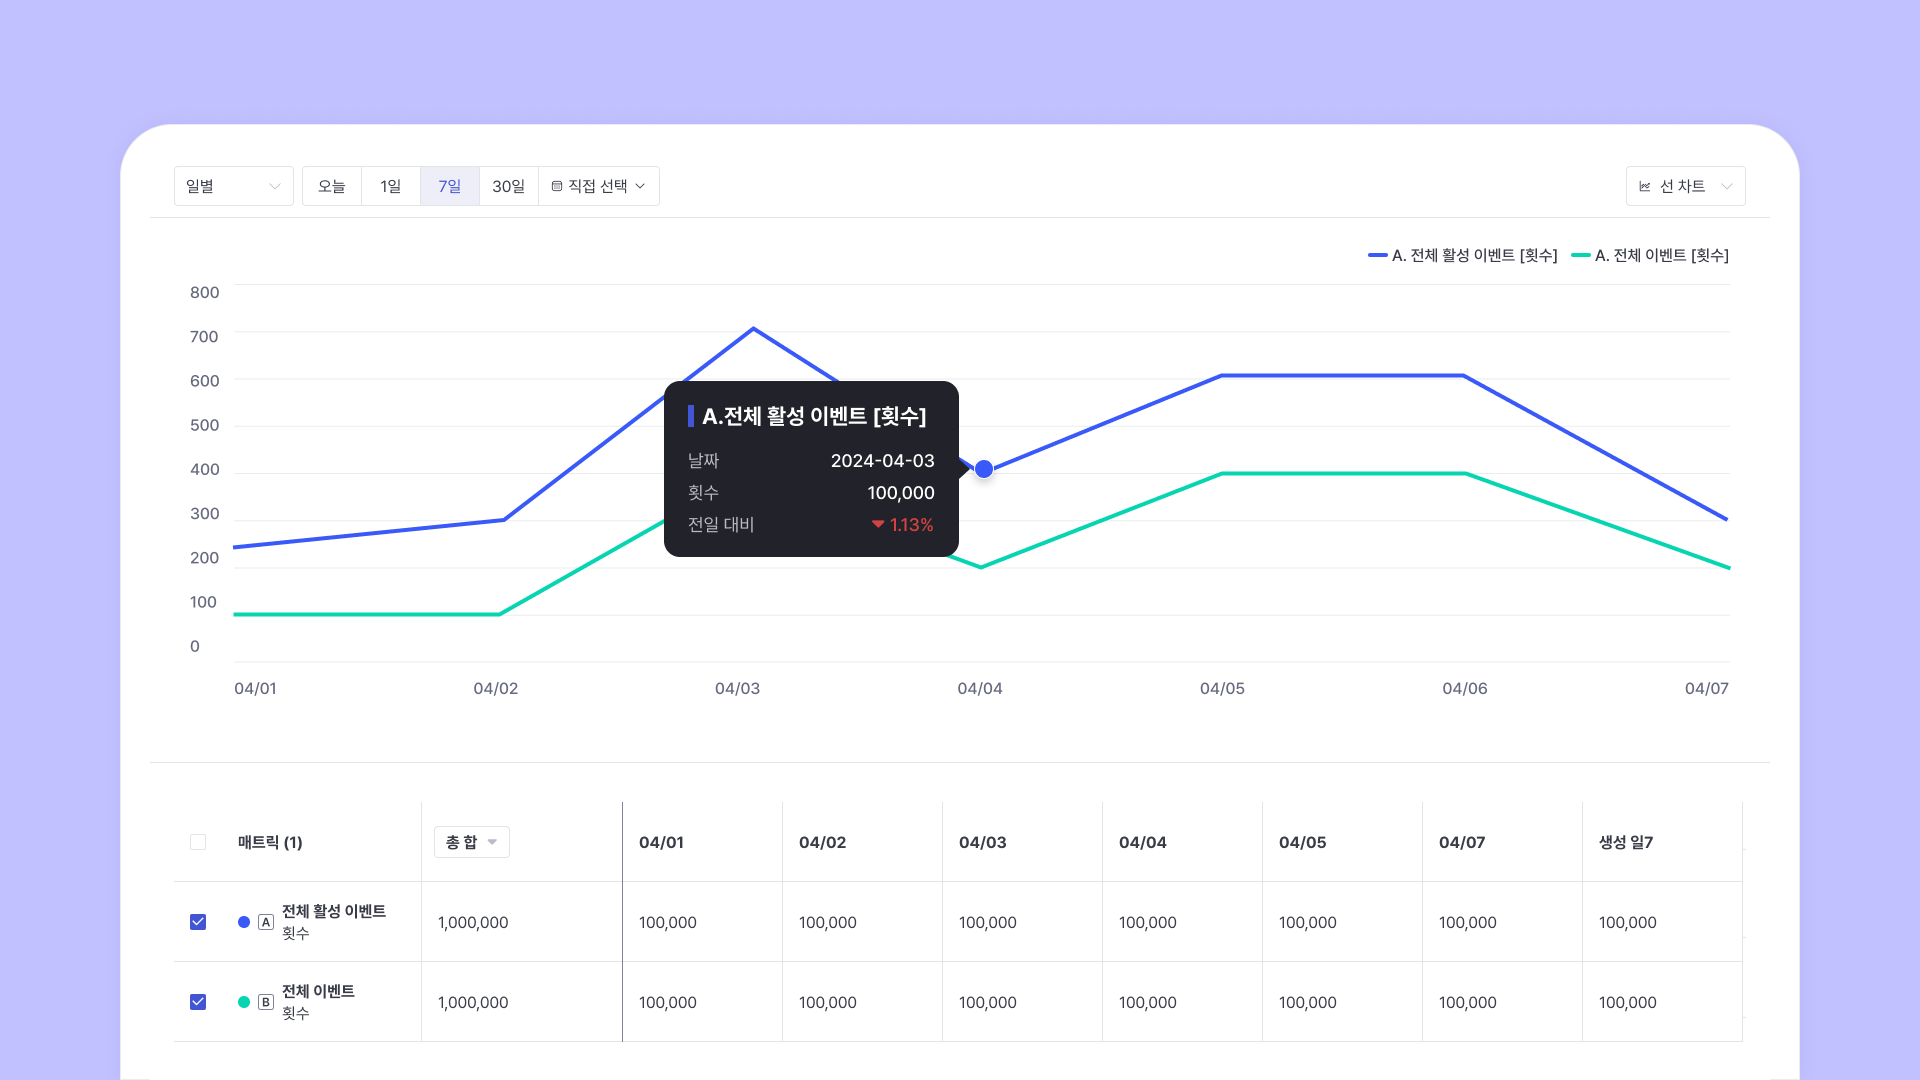
Change the analysis period and query unit
When you change the analysis period and query unit in the upper left area when creating a report, the changes are applied in real time. In DFINERY, you can check data by hour, day, week, and month, and the query period varies depending on each query unit.
Period Range Restriction
By hour
Up to 7 days
Up to 100 days
Daily
Up to 100 days
Up to 100 days
By week
Up to 15 weeks
Up to 15 weeks
By month
Up to 6 months
Up to 6 months
Doesn't exist
Same as daily picker
Up to 100 days
Future Limit
By hour
Available for selection up to 1 year in the future as of the current date
No choice of future
Daily
Available for selection up to 1 year in the future as of the current date
No choice of future
By week
As of this week, you can choose up to one year in the future
No choice of future
By month
Available for selection up to 1 year into the future as of this month
No choice of future
Doesn't exist
Same as daily picker
No choice of future
Change the visualization method
You can view the report in a visualization format that is appropriate for understanding and analyzing the indicators.
Limit Rule
A total of 200 reports can be generated per service (service account).
The maximum period that can be selected when aggregating attributes is 100 days .
Last updated